Analysis of Environmental Stress and Accelerated Reliability Testing for Sensors
Analysis of Ongoing Environmental Stress Testing of FUTEK Sensors
Date: July 2007, Revised February 2026
Abstract
This paper summarizes the results of ongoing environmental stress reliability testing of FUTEK S-Beam type sensors through various temperature and loading cycles. Thirty-six individual sensors are being tested and have accumulated between 900,000 and 1.4 million cycles each. There have been two minor (cable) failures at 900,000 hours and 950,000 hours. Based on this latest available test data, we can predict very conservatively that the MTBF of these non-repairable units is 2.56 million cycles and that within an 80% confidence limit the end-of-life for all units would be an average of 5 million cycles, with some lasting as long as 8 million cycles. The paper goes on to examine the results of long-term reliability endurance testing of a FUTEK S-Beam sensor that has survived over 2.07 billion cycles of accelerated stress testing. The projected MTBF of that unit is 781 million cycles with a 95% confidence factor.
Description of Stress Testing Program
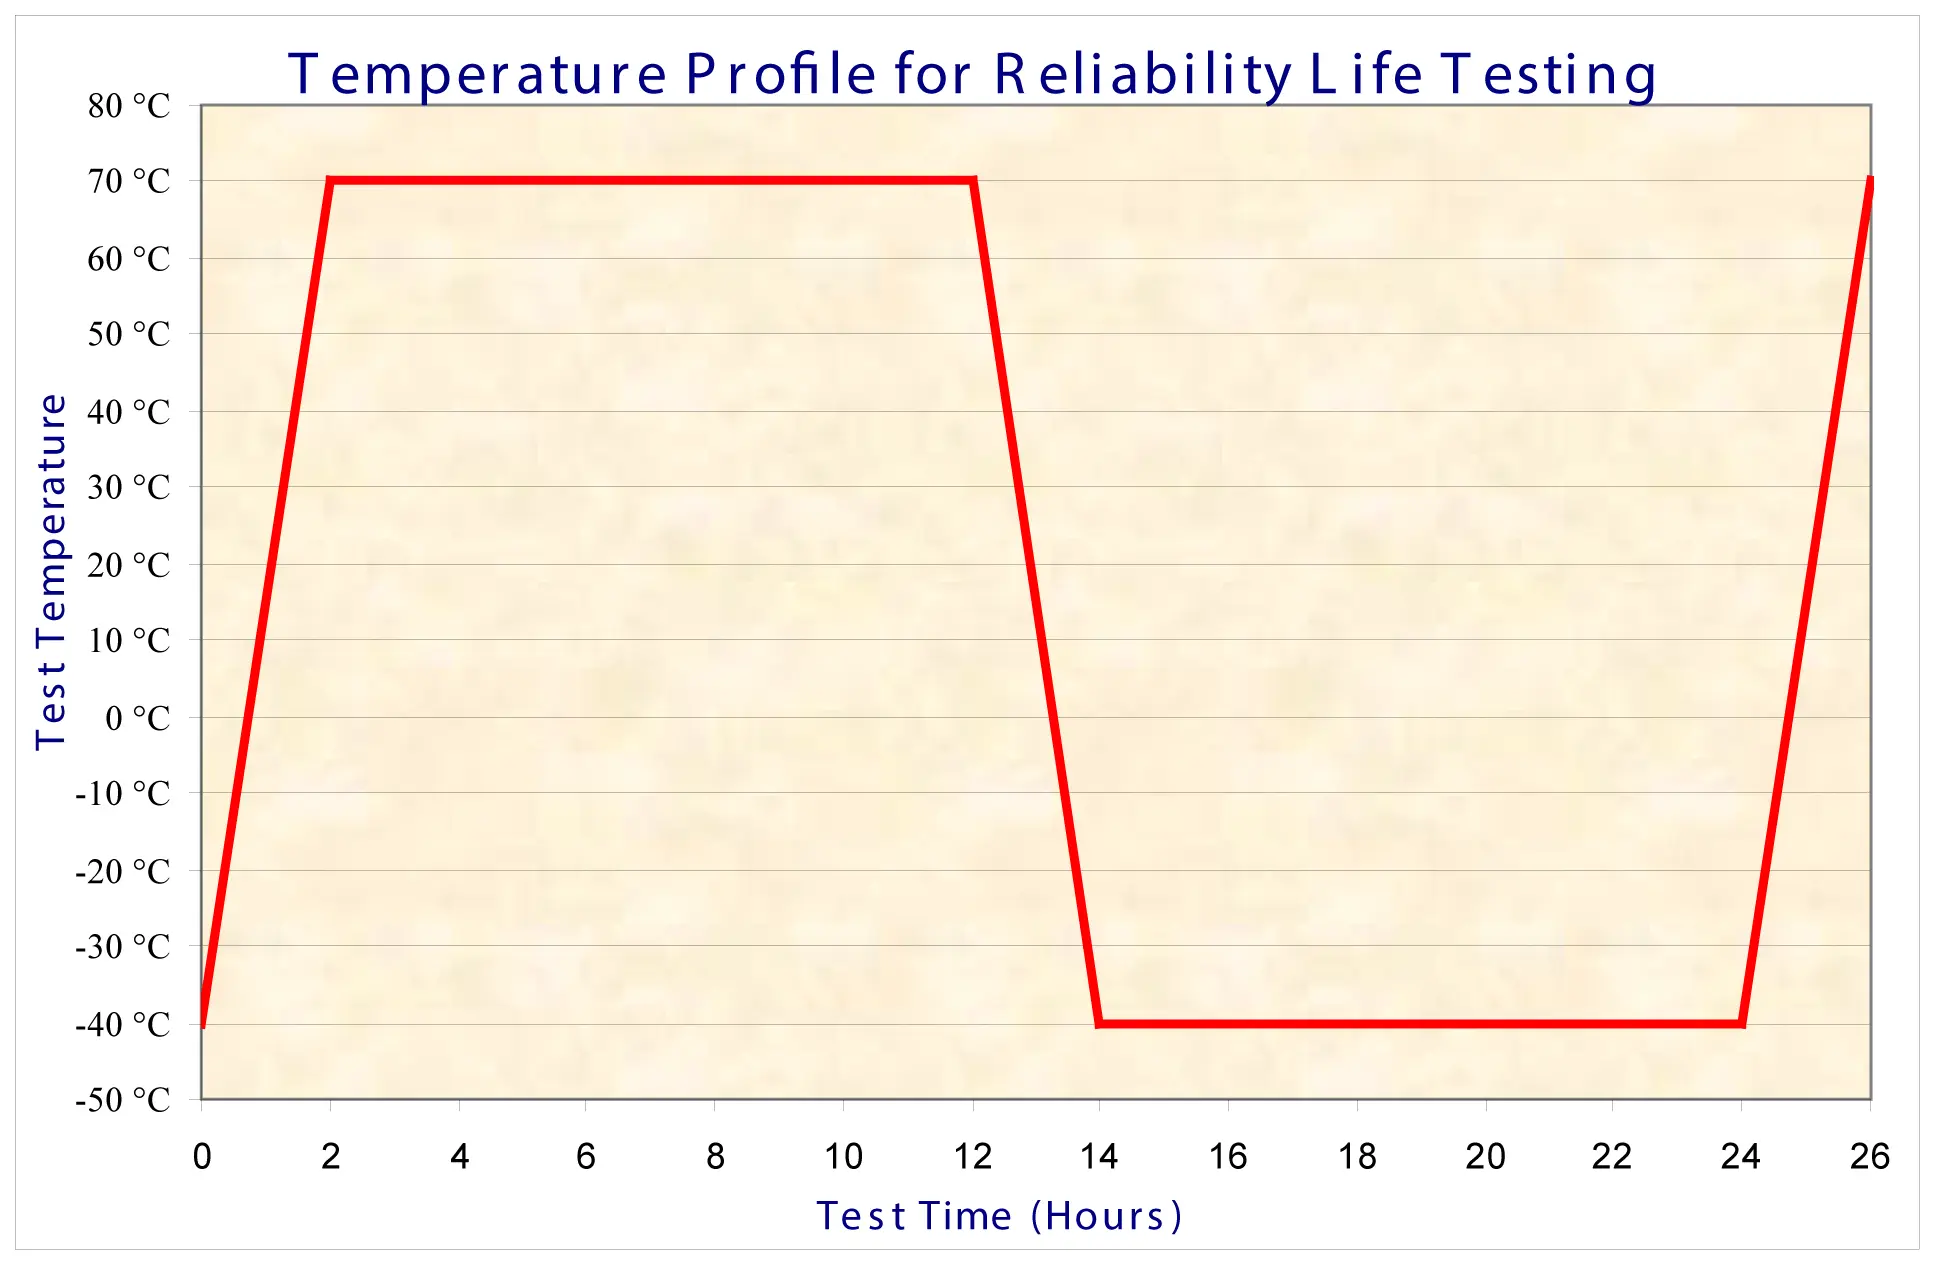
Environmental stress and load testing are being conducted on FUTEK S-Beam type load cells as a part of our ongoing efforts to continually improve the reliability of our sensors and establish firm reliability data on which industry can rely. The test comprises 36 parts cycling through various load and temperature profiles. There are 12 parts cycling through full-scale load (±25 lb) and temperature cycling from -40°C to +70°C following the temperature profile shown on the right. Twelve of the units are loaded to one-half rated output (±12½ lb) with the same temperature cycling. Twelve of the units were being cycled through the temperature profile with no loading. Two of the units in each of the three lots are control samples outside of the thermal chamber and are not experiencing the temperature cycling. All of the units were removed from the test fixture every 50,000 hours to verify their performance. During the testing there were two cable (not sensor) failures at 900,000 hours and 950,000 hours, respectively.
Analysis of Test Results
Taking all of the test results in aggregate, regardless of loading or temperature cycling, we are able to plot a reliability graph for the parts. This graph is shown in Figure One below and represents the probability that a unit will survive which is, mathematically, one minus its failure rate. It was found that the data set is best represented by a Normal Distribution. While a two- or three-parameter Weibull distribution is normally used for this class of failure data, the Weibull equations were non-convergent for this data set, and confidence bounds could not be established, probably due to the imbalance of only two failures and 34 parts still surviving.
A number of important factors can be derived from this reliability graph. The left vertical scale on the graph is the reliability factor, but it can also be read as the percent of units surviving. First, we see that the MTBF (actually MTTF since these units are not repairable) predicted by this data set is 2.56 million operational cycles. This is very significant because it exceeds the expected service life of typical products by more than a factor of 2½. We can also say with an 80% confidence factor that the MTBF figure must fall between 1.44 million and 3.68 million operational cycles. The reliability graph also predicts that the end-of-life of the average unit will be about 5 million operational cycles, and that all units will survive between 2 million and 8 million cycles at the limits of the 80% confidence bounds.
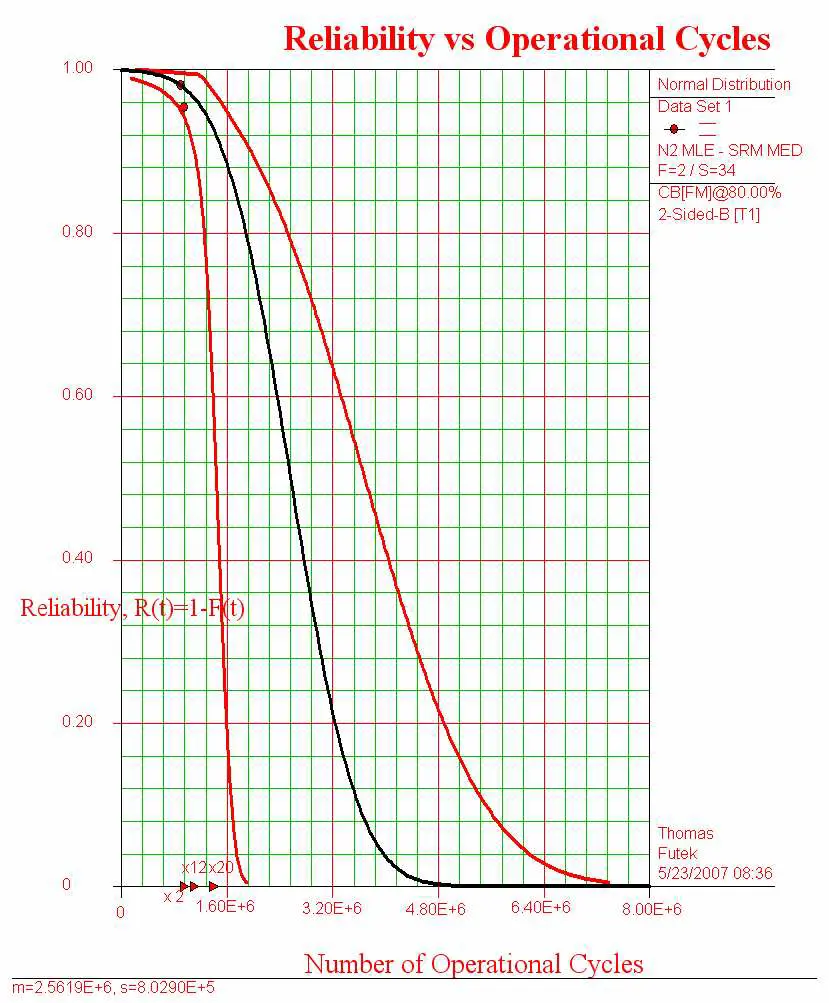
Figure One. FUTEK S-Beam reliability Life Test Data
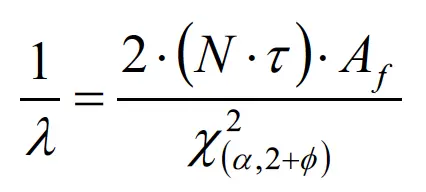
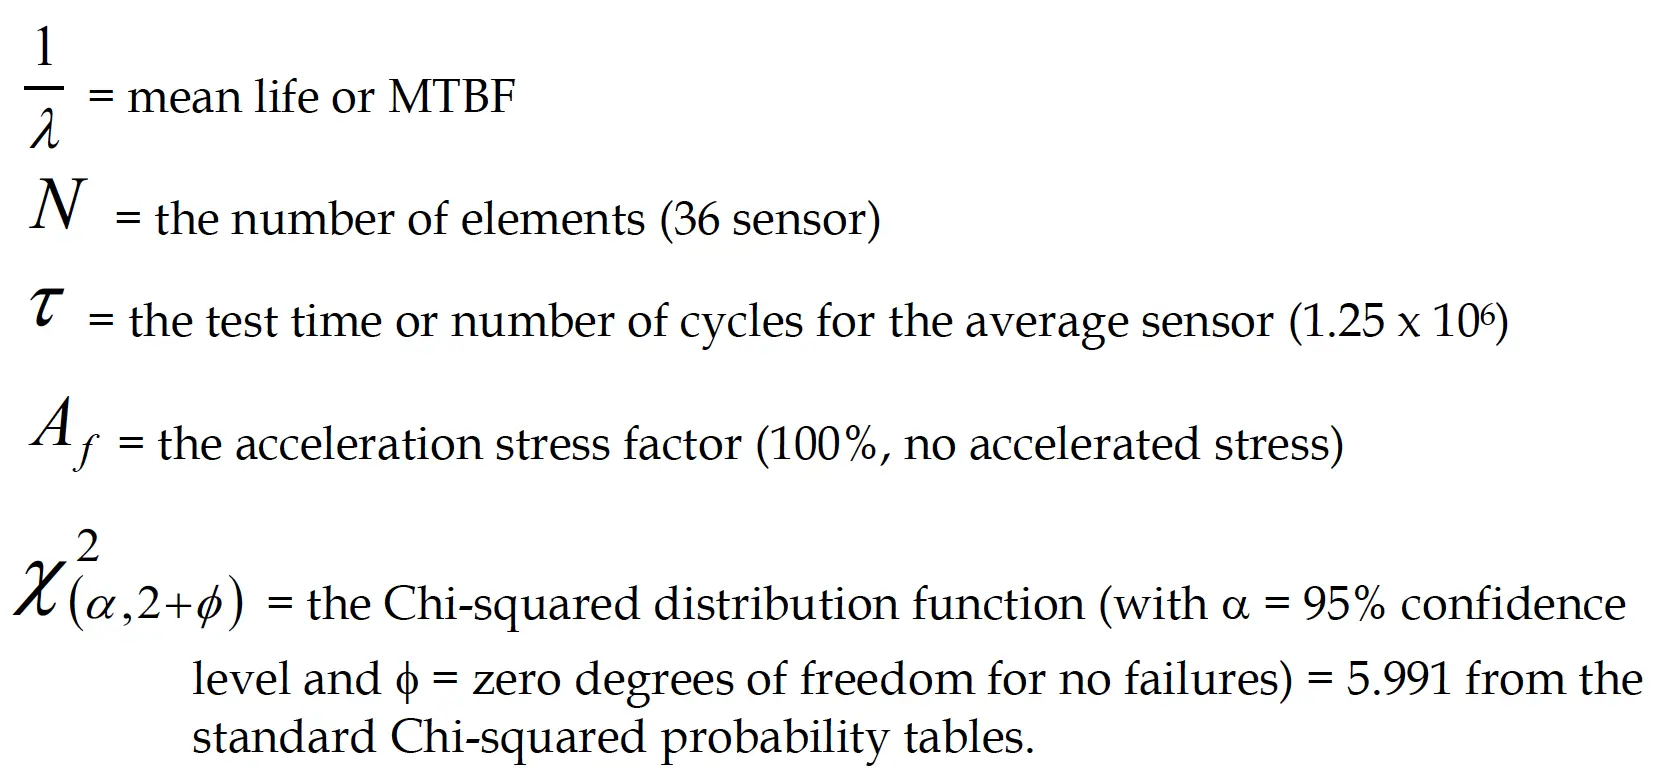
The foregoing analysis is very conservative in that it assumes that the two failures were a result of the stress testing where, in reality, the cable damage was probably caused through handling during the disassembly and calibration run every 50,000 hours. If we attribute these failures to handling and not to inherent failures of the sensor, we can re-examine the data, assuming that there were no failures and that all units are surviving. Unfortunately, with no failures we cannot compute a true failure rate using traditional analysis. We can, however, compute a “mean life” based on a one-sided Chi-squared distribution within a specified confidence limit, say 95%. We could then say that we are 95% confident that the mean life or MTBF is at least so much. The calculation goes like this:
Where:
This evaluates to:
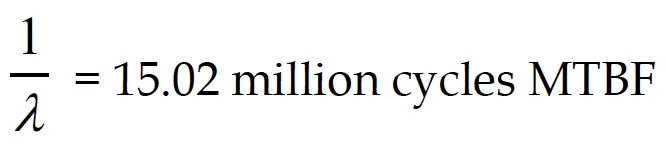
The result is an estimated MTBF of 15 million cycles for these sensors if no operational failures are considered. Obviously, considering the two possible failures, as we did above, gives us a much more conservative estimate to work with. All of the above estimates can be refined, and the confidence bounds tightened as additional test results become available through ongoing testing.
Reliability Endurance Testing
FUTEK is also conducting long-term reliability endurance testing of our S-Beam type sensors. We have done significant long-term accelerated Reliability life testing with our model LSB302 (100 lb) “S-Beam” load cell. This aluminum load beam is very representative of the load cells we produce. The accelerated life test began in August of 2001, with the unit being loaded at 3 cycles per second to 113% of rated output at room temperature. As the life test reached 180 million cycles, the load was increased to 150% of rated output. The unit has completed over 2.07 billion cycles and continues to operate within specifications at 113% of rated output. Occasionally, the unit is removed from the test stand and run through full calibration procedures to confirm and document its characteristics. If we assume the average stress over the life of the test to be 113%, we can say this accelerated stress test is roughly equivalent to 2.34 billion operating cycles at rated stress. Unfortunately, there have been no failures for the one unit on test. Without any failures, we cannot compute a true failure rate. Ideally, you would prefer to run many units at high enough stress to generate some failures. Then, a true failure rate can be computed by a Weibull distribution function using the failure data combined with the suspense data (data on the units that had not failed).
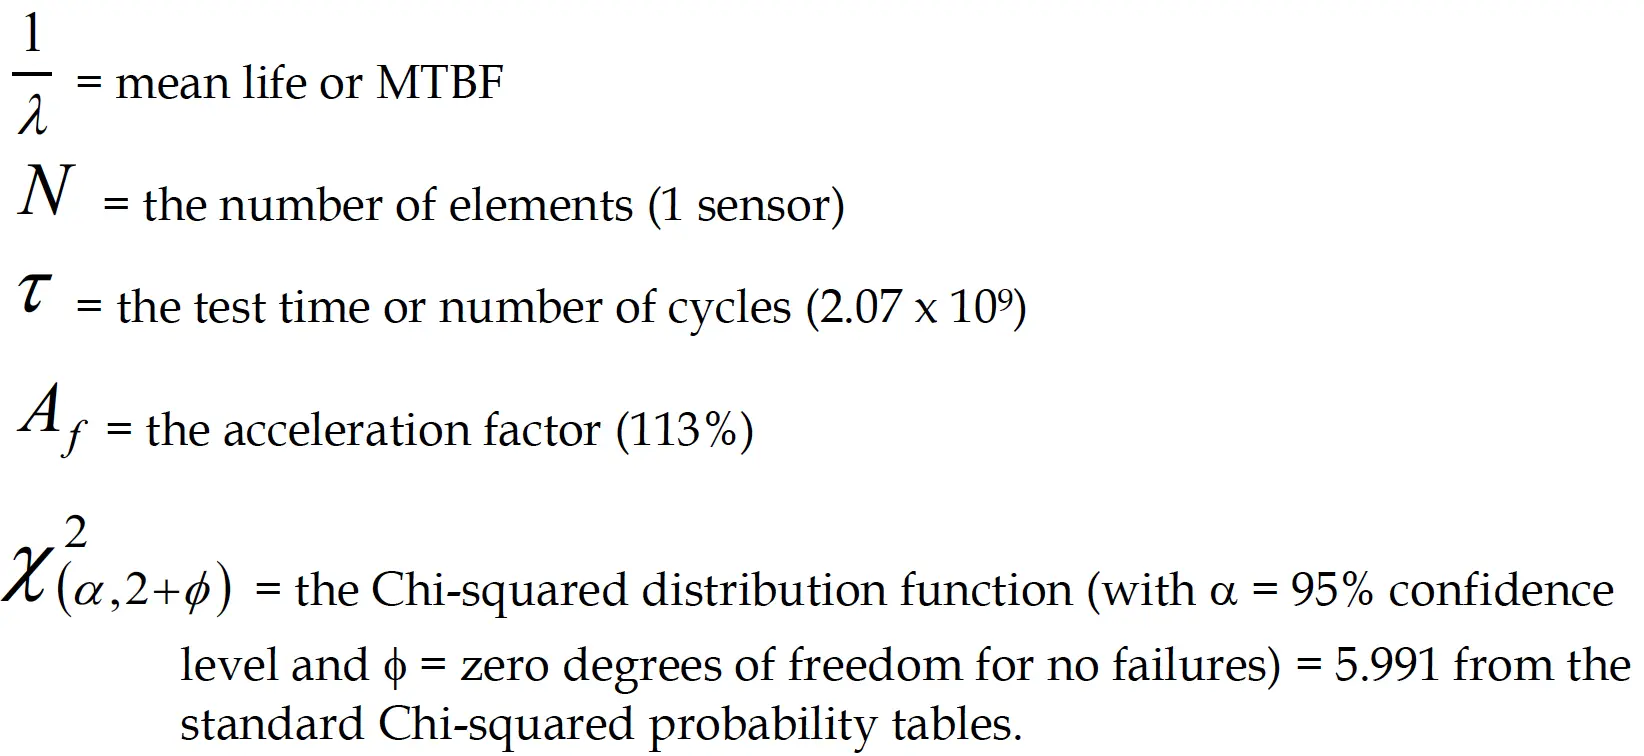
We can, however, compute a “mean life” based on a one-sided Chi-squared distribution within a specified confidence limit, say 95%. We could then say that we are 95% confident that the mean life or MTBF is at least so much. The calculation goes like this:
Where:
This evaluates as:
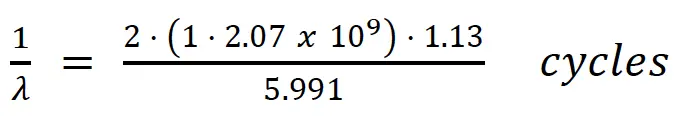
or,
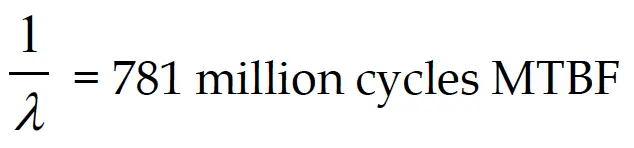
Based on this long-term reliability endurance test, we can assert that we are 95% confident that the mean life or MTBF of this sensor exceeds 781 million cycles. This applies to the entire population and implies that, although one unit has exceeded 2.07 billion cycles, in a large population, some of them would have failed earlier and some later. What this really means is that we are 95% confident that the MTBF of this model lies between 781 million cycles and some upper bound much larger than 781 million cycles. It should also be understood that this estimate applies to the overall population and that any particular sensor’s Reliability will depend on the specific application, the direct and axial loads applied, and, to a lesser extent, the environmental and vibration stresses it is subjected to. Overloading, elevated temperatures beyond spec, and extraneous loads can severely degrade the performance of any sensor. One other note about expressing reliability numbers — since load cells are not repairable, we are really measuring mean time to [first] failure, MTTF. However, it is common in the field to refer to this Reliability measure generically as MTBF, with the understanding that it applies to the first failure occurrence since the units are non-repairable. The math is the same for both, only the nomenclature differs.
As the unit under test continues to operate successfully, the 2.07 billion cycles Reliability estimate can be updated and reevaluated; it will continue to grow until a failure is experienced. This estimate represents the inherent or optimum Reliability of the component in a totally benign environment with no extraneous stresses and is not de-rated for any environmental factors. It is also important to understand that we are stating the reliability for the entire system, not just the flexure. Everything is under test including the flexure, gages, wiring, solder joints, terminals, adhesives, curing and coatings. That includes every element in the system that could contribute to a failure. The aluminum flexure, stressed within its limits, is probably one of the lowest failure rate elements in the system.
Related Reliability Field Experience
FUTEK also monitors the actual field experience of our sensors where that data is available. For example, we can look to our success with the LSM200 model load cells delivered to a single customer in 2002. We delivered 13,500 units over an eight-month period and experienced only three failures due to manufacturing defects. This is an exceptional accomplishment, representing a success rate of 0.999778, or return rate of 0.022%. In terms of “Six-Sigma Quality” fundamentals this would represent a 5-sigma process. Still, this is not purely a Reliability number, but rather a manufacturing process capability measure. To be able to quote Reliability factors associated with this performance, we would have to understand more about the operating hours, the application, duty cycles, stresses and environment, and when the three failures occurred. Additionally, we would need to understand the root cause of any failures to determine if they are attributable failures from a Reliability standpoint. All of these factors go into determining the Reliability of a product population. None of that customer data is available to us, but we can still point to this as an example as an exceptionally fine manufacturing process capability, a measure commonly associated with CPK.